The Lithium Battery SOC Chart provides an accurate representation of the state of charge of lithium batteries. Lithium batteries are widely used in various electronic devices and electric vehicles due to their high energy density and longer lifespan.
Monitoring these batteries’ state of charge (SOC) is crucial for optimizing their performance and preventing over-discharge or over-charge.
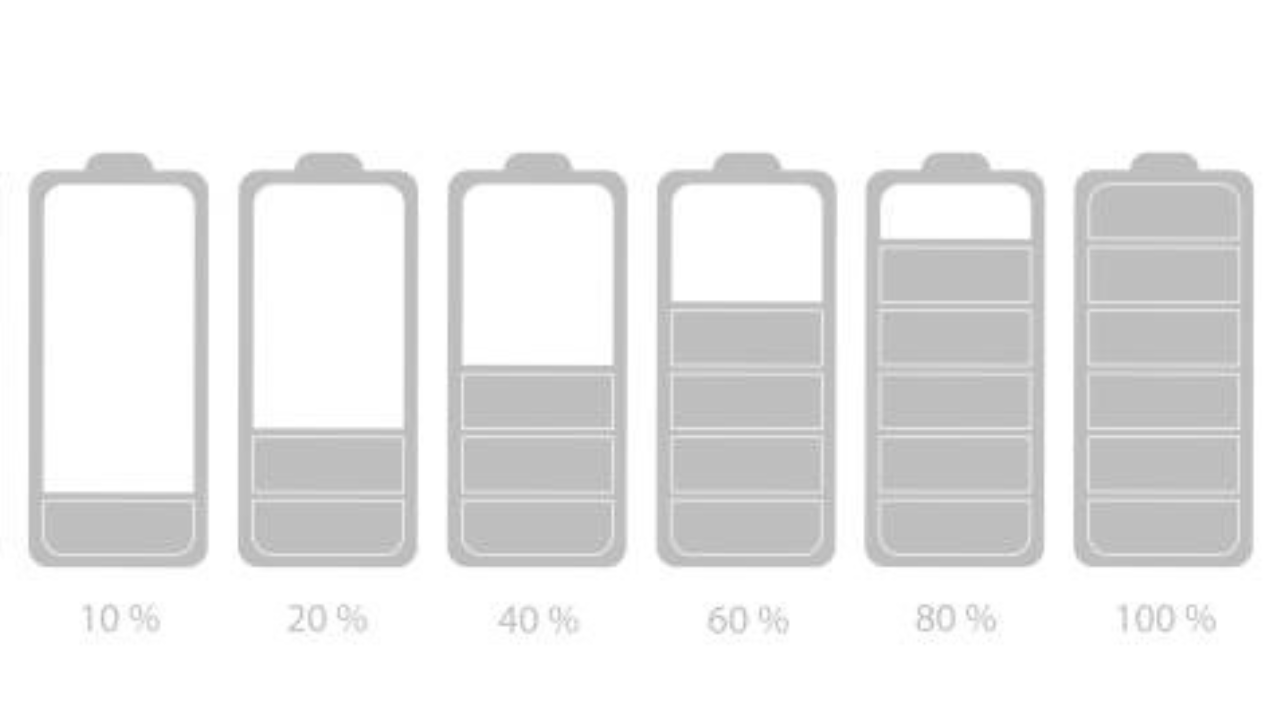
The SOC chart visually displays the battery’s remaining capacity as a percentage, allowing users to determine how much charge is left at any given time.
Understanding the SOC chart is essential for effectively managing lithium batteries and ensuring they operate within their optimal range. This article will delve into the details of the SOC chart, including its components and how to interpret the information it provides.
By the end, you will have a comprehensive understanding of utilizing the SOC chart for efficient battery management.

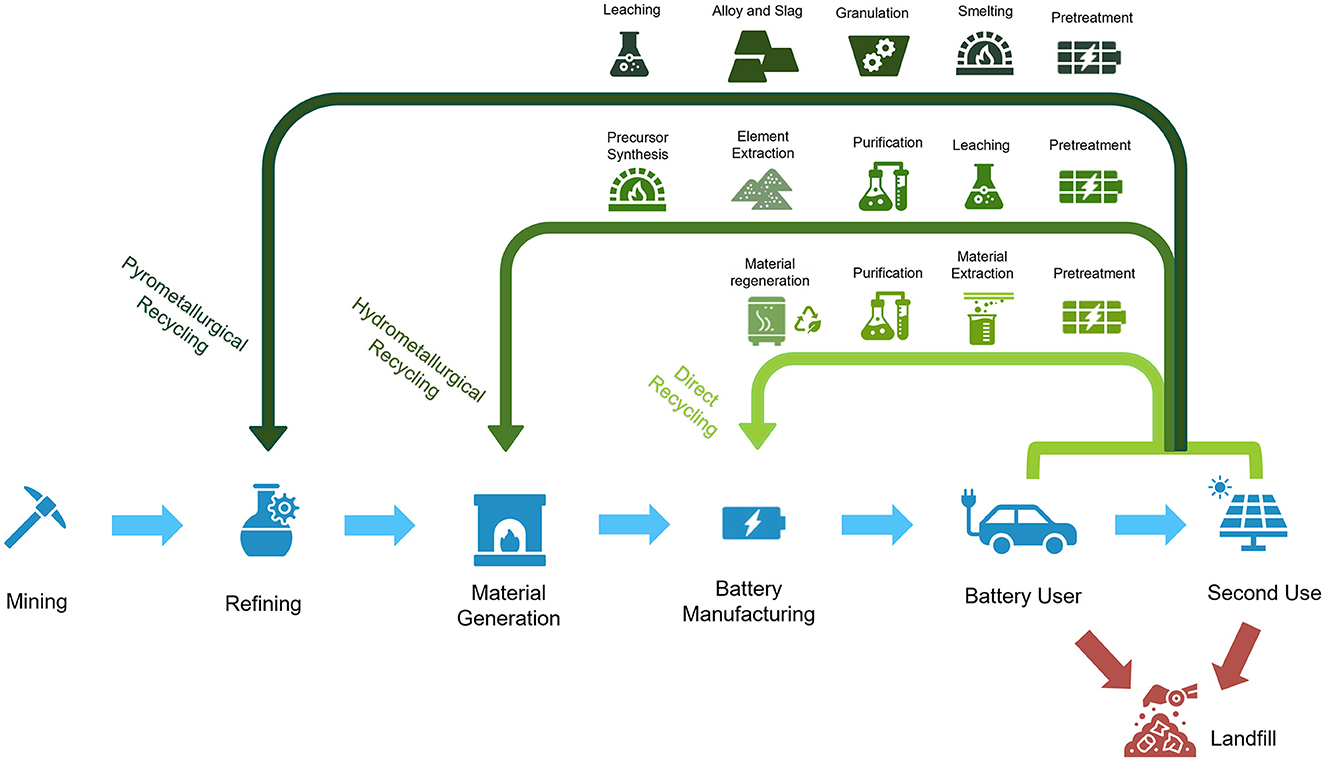
Credit: www.mdpi.com
Understanding Soc Charts
Understanding SOC Charts is crucial when it comes to monitoring the level of charge in lithium batteries. These charts provide valuable information about battery capacity and help ensure efficient power management.
Definition And Purpose Of Soc Charts
Lithium battery SOC (State of Charge) charts are graphical representations that visually showcase the relationship between battery voltage and its remaining capacity. These charts help users gauge the battery’s available energy at any given time.
The purpose of SOC charts is to provide a convenient and accurate way to estimate battery charge levels, enabling effective management of power usage.
Components Of An Soc Chart
A SOC chart comprises two main components – the x-axis and the y-axis. The x-axis represents battery voltage, whereas the y-axis signifies battery capacity. By plotting the voltage against the corresponding capacity, SOC charts display the battery’s charge level over a particular range.
This helps users understand how much energy they can expect from a battery at a given voltage.
How Soc Charts Are Created
Creating a SOC chart involves thoroughly testing a lithium battery by charging it fully and then discharging it while taking periodic voltage and capacity readings. These readings are then plotted on a graph, resulting in a SOC chart that reflects the battery’s behavior.
This process allows manufacturers and users to understand how a particular battery performs under different conditions, providing valuable insights into its charging and discharging characteristics.
Understanding Soc Chart Axes
Proper comprehension of the axes in a SOC chart is crucial for accurately interpreting the information presented. The x-axis represents the battery voltage, ranging from minimum to maximum. The y-axis denotes the battery capacity, typically measured in ampere-hours (Ah) or percentage (%).
It represents the charge remaining in the battery. By examining the interplay between voltage and capacity on the chart, users can gauge the battery’s charge level and make informed decisions regarding its usage.

Credit: www.frontiersin.org
Unlocking The Power Of Energy Storage
Energy storage has become crucial in the quest for clean and sustainable power sources. Among the various technologies available, Lithium battery SOC charts have proven to be an effective tool in unlocking the power of energy storage.
SOC, or State of Charge, represents the energy remaining in a battery at a specific moment. By understanding and optimizing battery performance through SOC charts, energy storage systems can achieve remarkable efficiency and reliability. Let’s delve deeper into this fascinating subject.
Optimizing Battery Performance With Soc Charts
SOC charts play a pivotal role in maximizing the performance of lithium batteries. These charts provide critical insights into the battery’s state of charge at various operating conditions, enabling efficient energy management.
With SOC charts, it becomes easier to determine the ideal charging and discharging rates, preventing overcharging or deep discharges that can damage the battery. By applying the information obtained from these charts, energy storage systems can optimize battery usage and prolong its lifespan.
Benefits Of Soc Charts In Energy Storage Systems
The advantages of using SOC charts in energy storage systems are manifold. Firstly, SOC charts offer accurate real-time monitoring, allowing users to keep track of the battery’s energy levels with precision. Knowing the SOC helps ensure an uninterrupted power supply and avoid potential energy shortfalls.
Additionally, SOC charts aid in predicting battery life and estimating the remaining capacity. This foresight enables better planning and prevents unexpected downtime, boosting overall system reliability.
Another key benefit lies in identifying battery degradation patterns through SOC charts. Over time, a battery’s capacity may decrease due to aging and other factors.
SOC charts allow users to monitor and detect these changes, facilitating timely maintenance or battery replacement. By taking proactive measures, Systems for storing energy can reduce downtime and maximize economic viability.
Applications Of Soc Charts In Renewable Energy
Renewable energy sources, like wind and solar, often exhibit inherent intermittency, challenging the stability of the power supply. This is where SOC charts prove invaluable. By incorporating SOC charts into renewable energy systems, operators can accurately gauge the battery’s state of charge and determine the available energy capacity.
This knowledge ensures efficient integration of renewable energy, mitigating fluctuations and improving system stability. SOC charts enable seamless energy management, making renewable energy sources more reliable and viable.
Future Trends In Soc Chart Development
The development of SOC charts continues to evolve, with ongoing research focusing on enhancing accuracy and usability. Advancements in data analytics and machine learning techniques hold promise in improving SOC predictions, enabling even more precise energy management.
Furthermore, integrating SOC charts with innovative grid technologies is increasingly gaining traction. This integration ensures seamless communication between energy storage systems and the grid, facilitating optimal energy utilization and stability.
| Key Takeaways |
|---|
| · SOC charts optimize battery performance in energy storage systems, extending battery life and enhancing reliability. |
| · SOC charts provide accurate real-time monitoring, aiding in uninterrupted power supply and preventing downtime. |
| · SOC charts facilitate the integration of renewable energy by improving stability and energy management. |
| · Future trends in SOC chart development involve enhanced accuracy through data analytics and integration with smart grid technologies. |

Credit: onlinelibrary.wiley.com
48v lithium battery soc chart
The State of Charge (SOC) chart for a 48V lithium battery represents its current charge level as a percentage of its total capacity. Here’s a general SOC chart that you might find helpful:
- 100% SOC: Fully charged
- 80-90% SOC: High charge, optimal for extended battery life
- 60-80% SOC: Good charge, a balance between capacity and longevity
- 40-60% SOC: Moderate charge, suitable for storage or daily cycling
- 20-40% SOC: Low charge, approaching the lower limit for regular use
- 0-20% SOC: Deficient charge, consider recharging to prevent deep discharge
Remember that specific battery models and chemistries may have slightly different optimal SOC ranges, and it’s always advisable to refer to the manufacturer’s guidelines for your particular lithium battery. Monitoring and managing SOC is crucial for maximizing battery lifespan and performance.
Frequently Asked Questions Of Lithium Battery Soc Chart
What Is The Soc Of A Lithium Battery?
The SOC of a lithium battery refers to its State of Charge, indicating how much energy it currently holds. It measures the battery’s capacity, expressed as a percentage. Monitoring the SOC helps determine its charge level and estimate its remaining runtime.
What Is The Best Soc To Store Lithium Battery?
The best SOC (state of charge) to store lithium batteries is between 50% and 70%.
What Is The Best Soc Range For Lifepo4?
The best SOC range for LiFePO4 is typically between 20% and 80%. This range ensures optimal battery performance and longevity.
What Should Soc Be On A Battery?
The SOC, or state of charge, on a battery, refers to the amount of energy it currently holds. Keeping the SOC between 20% and 80% is generally recommended to maximize battery life and performance.
Conclusion
The Lithium Battery Soc Chart provides a comprehensive overview of the state of charge (SOC) of lithium batteries. This valuable resource offers insights into the SOC levels at different stages of battery life, allowing users to make informed decisions regarding battery usage and maintenance.
With its user-friendly interface and up-to-date data, this chart is an essential tool for anyone working with lithium batteries. By understanding SOC levels, users can optimize battery performance and extend its lifespan. Stay informed and stay charged with the Lithium Battery Soc Chart.

I am a technology Specialized . I have experience in Technology, and all types of electronic devices like Battery . So I work on solving these issues and give various tips on these issues
